As part of a megaproject to establish the effects in the Gulf of Mexico ecosystem to deep water oil spills in the Mexican territorial waters, a large consortium (CIGoM) is constructing a database that includes physical, biogeochemical and ecological variables, as well as the results from numerical models.
The CIGoM data management team that I coordinated, deployed a computational platform for the administration of ocean data and geospatial services. Composed of open-source standards and tools used by geographic information systems, hence standardizing both the ocean data and the web services of the CIGOM data platform.
This approach facilitates the tasks of storage, cataloging, discovery, transmission, and visualization of information through well-established protocols at the international level, thereby achieving intergroup and interdisciplinary compatibility.
Our methodology was to firmly adhere to the abstract data feature types described in the Climate and Forecast Conventions, formating the data from numerical models, observations, and products to the most appropriate structure. Also, each data set has associated metadata, which allows the creation of a digital library that offers information discovery and federation services. For this, we developed an online process for capturing and receiving data sets (data and metadata).
The most attractive component we have is the web visualization functionality: we deployed the geospatial web framework Terriajs with which we can visualize by way of layers, the data available through data providing servers like ERDDAP, THREDDS and a custom built API for the non standard visualizations web services. Data can be also requested from external providers using standard protocols. The main advantage of using this technology is the flexibility of geospatial formats that we can visualize, such as: "Web Map Service", "GeoJson", "Cesium Language", "Keyhole Markup Language" among others, in addition to custom made interactive graphics like wind-roses, time series and vertical profiles at specific data points.
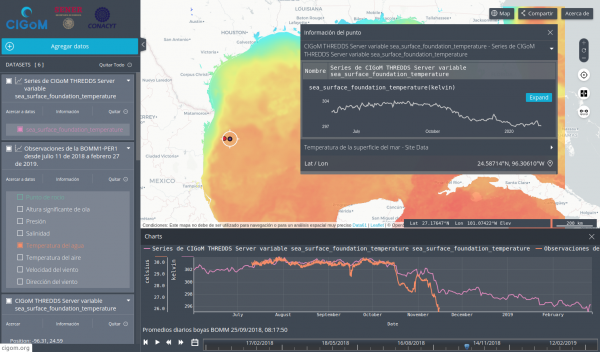
Data and visualization capabilities
The interactive web map that we compiled can create a very wide variety of data visualization compositions, leaving the user with many ways to explore the data from the CIGOM catalog.
I'll leave a few demostration of its features and the custom visualizations that we built.
The web application and data products at this moment requires credentials and authorization by the CIGOM data providers and managers.
The software and tools to build this map are being prepared to make them open source available. Any inquires, please feel free to contact me. In later posts, I'll be explaining in more detail the architecture of the solution.
Entradas relacionadas