Streamlist is a python framework that makes it extreamly easy to build and share interactive data analytics driven web applications, its open-source, and its rapidly growing user base.
I found about Streamlit in a twitter publication, and since then, I became trully interested in the project and wanted to give it a try. I could imagine a few projects in which it could come really useful.
One great feature that Streamlit is offering, its the possibility to deploy my app directly from streamlit. This basically works by creating a github repository with my streamlit app with all my data scripts and so on, then make it open, and deploy thru the streamlit.io service.
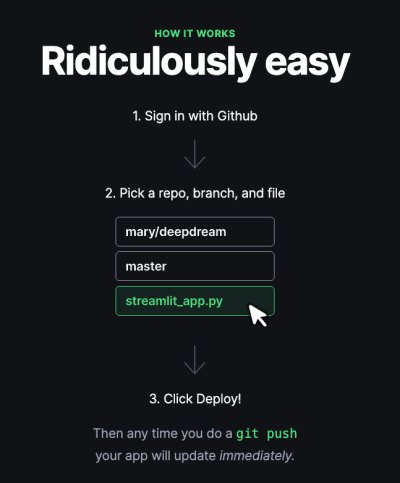
To get access to the free streamlit sharing service, you need to request an invite from them. So if you are interested, please, I recommend you go and get yours.
Streamlit has very straightforward scripting commands that allow you to:
- Add formated text using markdown
- Display formated data tables, like pandas DataFrames
- Display charts, from the most used plotting libraries like Vega Lite, Deck.gl, Altair, Plotly, Bokeh and matplotlib.. Many of this libraries make interactive plots.
- Display Media, images, video and audio that can be programmaticaly built from your app.
- Use interactive widgets, from which you can get the parameters to feed your data model. The widgets already built are buttons, sliders, text inputs, checkboxes, etc.
- A very well built cache system that can improve the performance of your app..
- Many more features, and of course the modularity that allow you to make your custom widgets.
My first app
For my first Streamlit app, I wanted to make something that could be useful in my current work community, so I built a dashboard!.
This dashboard sources its data from ERDDAP servers status page. (If you want to know about ERDDAP, check this post.). The status metrics go from a list of available datasets and their types, memory usage, timeseries with failed vs successful respondes, response times, etc.
ERDDAP Servers are commonly open to users to explore their datasets, so the app can request this metrics from those servers and visually explore the data.
This could be useful to administrators and project leaders to have a quick look on the health of their ERDDAP Servers.
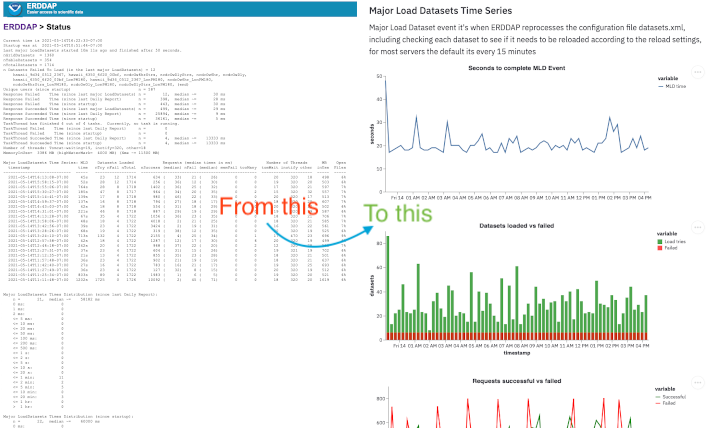
To build this dashboard I used the erddap-python library, that can parse all this metrics into scalars and pandas DataFrames, leaving just the work of creating the visualizations.
Usage sample
from erddapClient import ERDDAP_Server
remote = ERDDAP_Server('https://coastwatch.pfeg.noaa.gov/erddap')

print ("Memory usage (MB) -")
print ("Memory in use          : {:,} ".format(remote.statusValues['memoryinuse']))
print ("Memory high water mark : {:,} ".format(remote.statusValues['highwatermark']))
print ("Memory XMX             : {:,} ".format(remote.statusValues['xmx']))
Produces
Memory usage (MB) -
Memory in use          : 2,304
Memory high water mark : 10,177
Memory XMX             : 11,500
Having this, Streamlit has this very simple to follow scripting that produces web pre-design widgets that show in a React web application. Consider the following
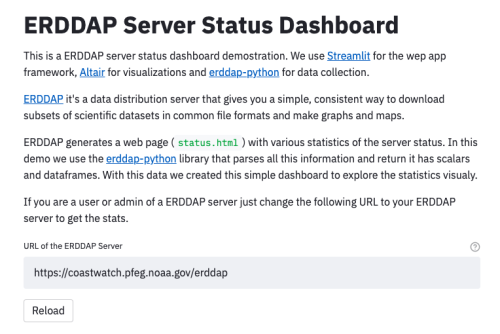
st.title("ERDDAP Server Status Dashboard")
st.write("This is a ERDDAP server status dashboard demostration.....")
...
url  = st.text_input("URL of the ERDDAP Server", DEFAULT_ERDDAPURL, help="Change this to get metrics from a different ERDDAP Server")
Produces:
Most of the source code to build this dashboard its mostly the chart arrangement, just a few Streamlit commands to position the elements and its pretty much ready, I didnt do any html, any javascript just python scripting!.
I definitely see myself improving this app, and working with many more.
Entradas relacionadas